

GA4 Basics
What Is GA4?
GA4, or Google Analytics 4, is Google’s analytics platform for tracking how people find and use your website or app. It helps you measure traffic, sessions, engagement, events, conversions, and which pages are helping your content perform.
Simple use: GA4 shows what visitors do after they land on your site.
Estimated reading time: 8 minutes
TechnofluxAI Dashboard Guide
How to Build an AI Search Visibility Dashboard With Search Console and GA4
AI search visibility is not only about ranking on a traditional search results page anymore. Your content needs to be discoverable, understandable, and useful enough for search engines, AI answer systems, and real people to recognize it as a strong source.
Quick Answer
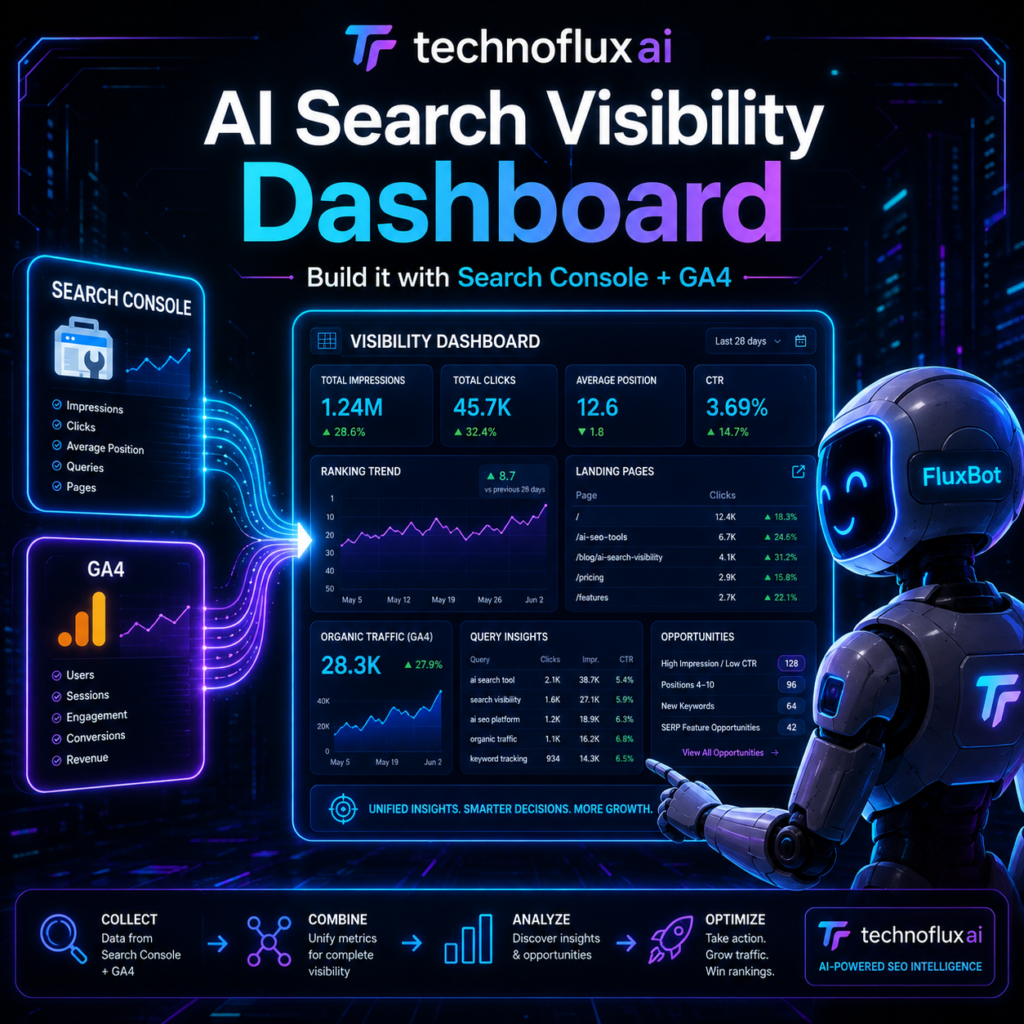
To build an AI search visibility dashboard, combine Google Search Console data for impressions, clicks, queries, pages, CTR, and position with GA4 data for sessions, engagement, conversions, and landing page behavior. Use the dashboard to find pages that are visible in search but not earning enough clicks, engagement, or AI-ready topical authority.
The Pain Point
Most creators check Search Console and GA4 separately. That makes it hard to see the full path from search visibility to actual reader behavior.
What This Dashboard Helps You Understand
This dashboard helps you spot content that is gaining impressions, losing click-through rate, attracting weak engagement, missing key query opportunities, or needing a GEO refresh for AI search systems. Instead of guessing which pages to update, you can prioritize pages based on visibility, traffic quality, and content improvement potential.
For broader AI search strategy, start with the AI Search SEO Checklist for 2026. For practical AI and GEO education, visit TechnofluxAI.
Dashboard Build Framework
What an AI Search Visibility Dashboard Should Track
A useful AI search visibility dashboard should not only show whether traffic went up or down. It should show which pages are becoming discoverable, which queries are creating opportunity, and which content needs stronger structure, freshness, authority, or engagement.
Search Console Layer
Use Google Search Console to understand search visibility: impressions, clicks, CTR, average position, queries, pages, countries, devices, and search appearance patterns.
GA4 Layer
Use GA4 to understand what visitors do after they arrive: sessions, engagement rate, average engagement time, events, conversions, landing pages, and traffic source quality.
GEO Insight Layer
Add an AI search review layer that checks whether important pages answer questions clearly, include fresh examples, use helpful headings, and connect to related topical pages.
The Core Dashboard Metrics
Start simple. A dashboard with too many charts becomes noise. The best first version should show search visibility, traffic quality, and content opportunity.
| Metric | Tool | Why It Matters |
|---|---|---|
| Impressions | Search Console | Shows whether Google is surfacing your pages for search queries. |
| Clicks | Search Console | Shows whether visibility is turning into visits. |
| CTR | Search Console | Helps identify pages with strong impressions but weak titles or meta descriptions. |
| Average position | Search Console | Shows where your pages tend to appear for tracked queries. |
| Sessions | GA4 | Shows actual site visits from organic search and other channels. |
| Engagement rate | GA4 | Shows whether visitors are interacting meaningfully with the page. |
| Key events or conversions | GA4 | Shows whether AI search and organic traffic support business goals. |
Step-by-Step: Build the Dashboard
- Choose your dashboard tool. Looker Studio is the easiest starting point because it can connect to Google data sources and create visual reports.
- Connect Google Search Console. Add your verified property and select the right data view for page and query reporting.
- Connect GA4. Add your GA4 property so you can compare search visibility with traffic and engagement.
- Create top-level scorecards. Add impressions, clicks, CTR, average position, organic sessions, engagement rate, and conversions.
- Add page-level tables. Show landing pages with impressions, clicks, sessions, engagement, and conversion data.
- Add query-level tables. Show the queries that are creating impressions and clicks for your most important pages.
- Create opportunity filters. Filter for high impressions with low CTR, rankings near page one, declining clicks, and pages with weak engagement.
- Add a GEO review column. Manually label pages that need clearer answers, better FAQs, stronger schema, updated screenshots, or stronger internal links.
Use Google’s official guide on using Search Console and Google Analytics data for SEO if you want to build the dashboard in Looker Studio.
Advanced Dashboard Strategy
Turn Search Data Into AI Visibility Decisions
A dashboard is only useful if it changes what you do next. The goal is to turn Search Console and GA4 data into better content updates, stronger internal links, clearer answers, and smarter GEO planning.
Add a Content Refresh Score
Score pages from 1 to 5 based on how urgently they need a title update, answer refresh, screenshot update, FAQ expansion, or stronger topical links.
Track Query Clusters
Group related queries into themes such as beginner questions, comparison searches, tool searches, problem searches, and AI search questions.
Create an AI Answer Readiness Tag
Label pages as ready, needs refresh, needs examples, needs citations, needs schema, or needs internal links.
Recommended Dashboard Tabs
Overview
Show total impressions, clicks, CTR, average position, organic sessions, engagement rate, and conversions.
Top Pages
Rank landing pages by visibility, traffic, engagement, and update opportunity.
Top Queries
Find queries that reveal user intent, missing sections, and future article ideas.
GEO Opportunities
List pages that need clearer answers, stronger entity coverage, better FAQs, fresh examples, or better internal linking.
For more AI search structure ideas, read Optimize for ChatGPT and What Is GEO?.
Common Mistakes to Avoid
Tracking Traffic Only
Traffic is not the full story. You also need impressions, queries, CTR, engagement, and content quality notes.
Ignoring Low CTR Pages
High impressions with weak CTR often mean the page is visible but not compelling enough to earn the click.
Not Segmenting Branded and Non-Branded Queries
Branded searches and discovery searches behave differently. Separate them so you understand real content discovery.
Forgetting Manual Review
A dashboard can show opportunity, but a human still needs to review whether the content truly answers the query better than competitors.
FAQ: AI Search Visibility Dashboards
What is an AI search visibility dashboard?
An AI search visibility dashboard is a reporting view that combines search visibility data, user behavior data, and content quality notes so you can improve SEO and GEO performance.
Can Search Console show AI Overview traffic?
Search Console can show Google Search performance data, but site owners should be careful about over-interpreting AI-specific visibility. Use Search Console trends, queries, pages, and click behavior as directional signals rather than a perfect AI citation tracker.
Why use GA4 with Search Console?
Search Console shows how pages perform in Google Search before the click. GA4 shows what users do after they land on your site. Together, they help you connect visibility with real engagement.
What pages should I update first?
Start with pages that have high impressions but low CTR, pages ranking near page one, pages with declining clicks, and pages that get traffic but weak engagement.
Do I need paid SEO tools to build this dashboard?
No. Search Console, GA4, and Looker Studio are enough for a strong beginner dashboard. Paid SEO tools can add competitor tracking and keyword databases, but they are not required for the first version.
Final Takeaway
An AI search visibility dashboard gives you a clearer way to improve content. Search Console tells you where your pages are appearing. GA4 tells you what visitors do next. Your GEO review layer tells you which pages need clearer answers, better structure, stronger examples, and fresher information.
Build Your First AI Visibility Dashboard This Week
Start with one page: connect Search Console, connect GA4, add your top pages and queries, then label each page with one next action. A simple dashboard you actually use is better than a complex dashboard you ignore.
Export Search Console Data Review GA4 Traffic Acquisition